data and the Globe
We chose to explore the technique of extracting information stored in pixel data as color by reverse engineering graphical image representations that explore the use of color coding. One such rich resource is maps and the most prevalent map is the map of the world.
The simpler hypothesis is based on the premise that data such as topography, air quality, vegetation excetra are all color coded information which we can manipulate using pixel decoding techniques. We are interested in the relationship between the physical and digital, and how we can use voxel technology to create a new expression.
at Global scale

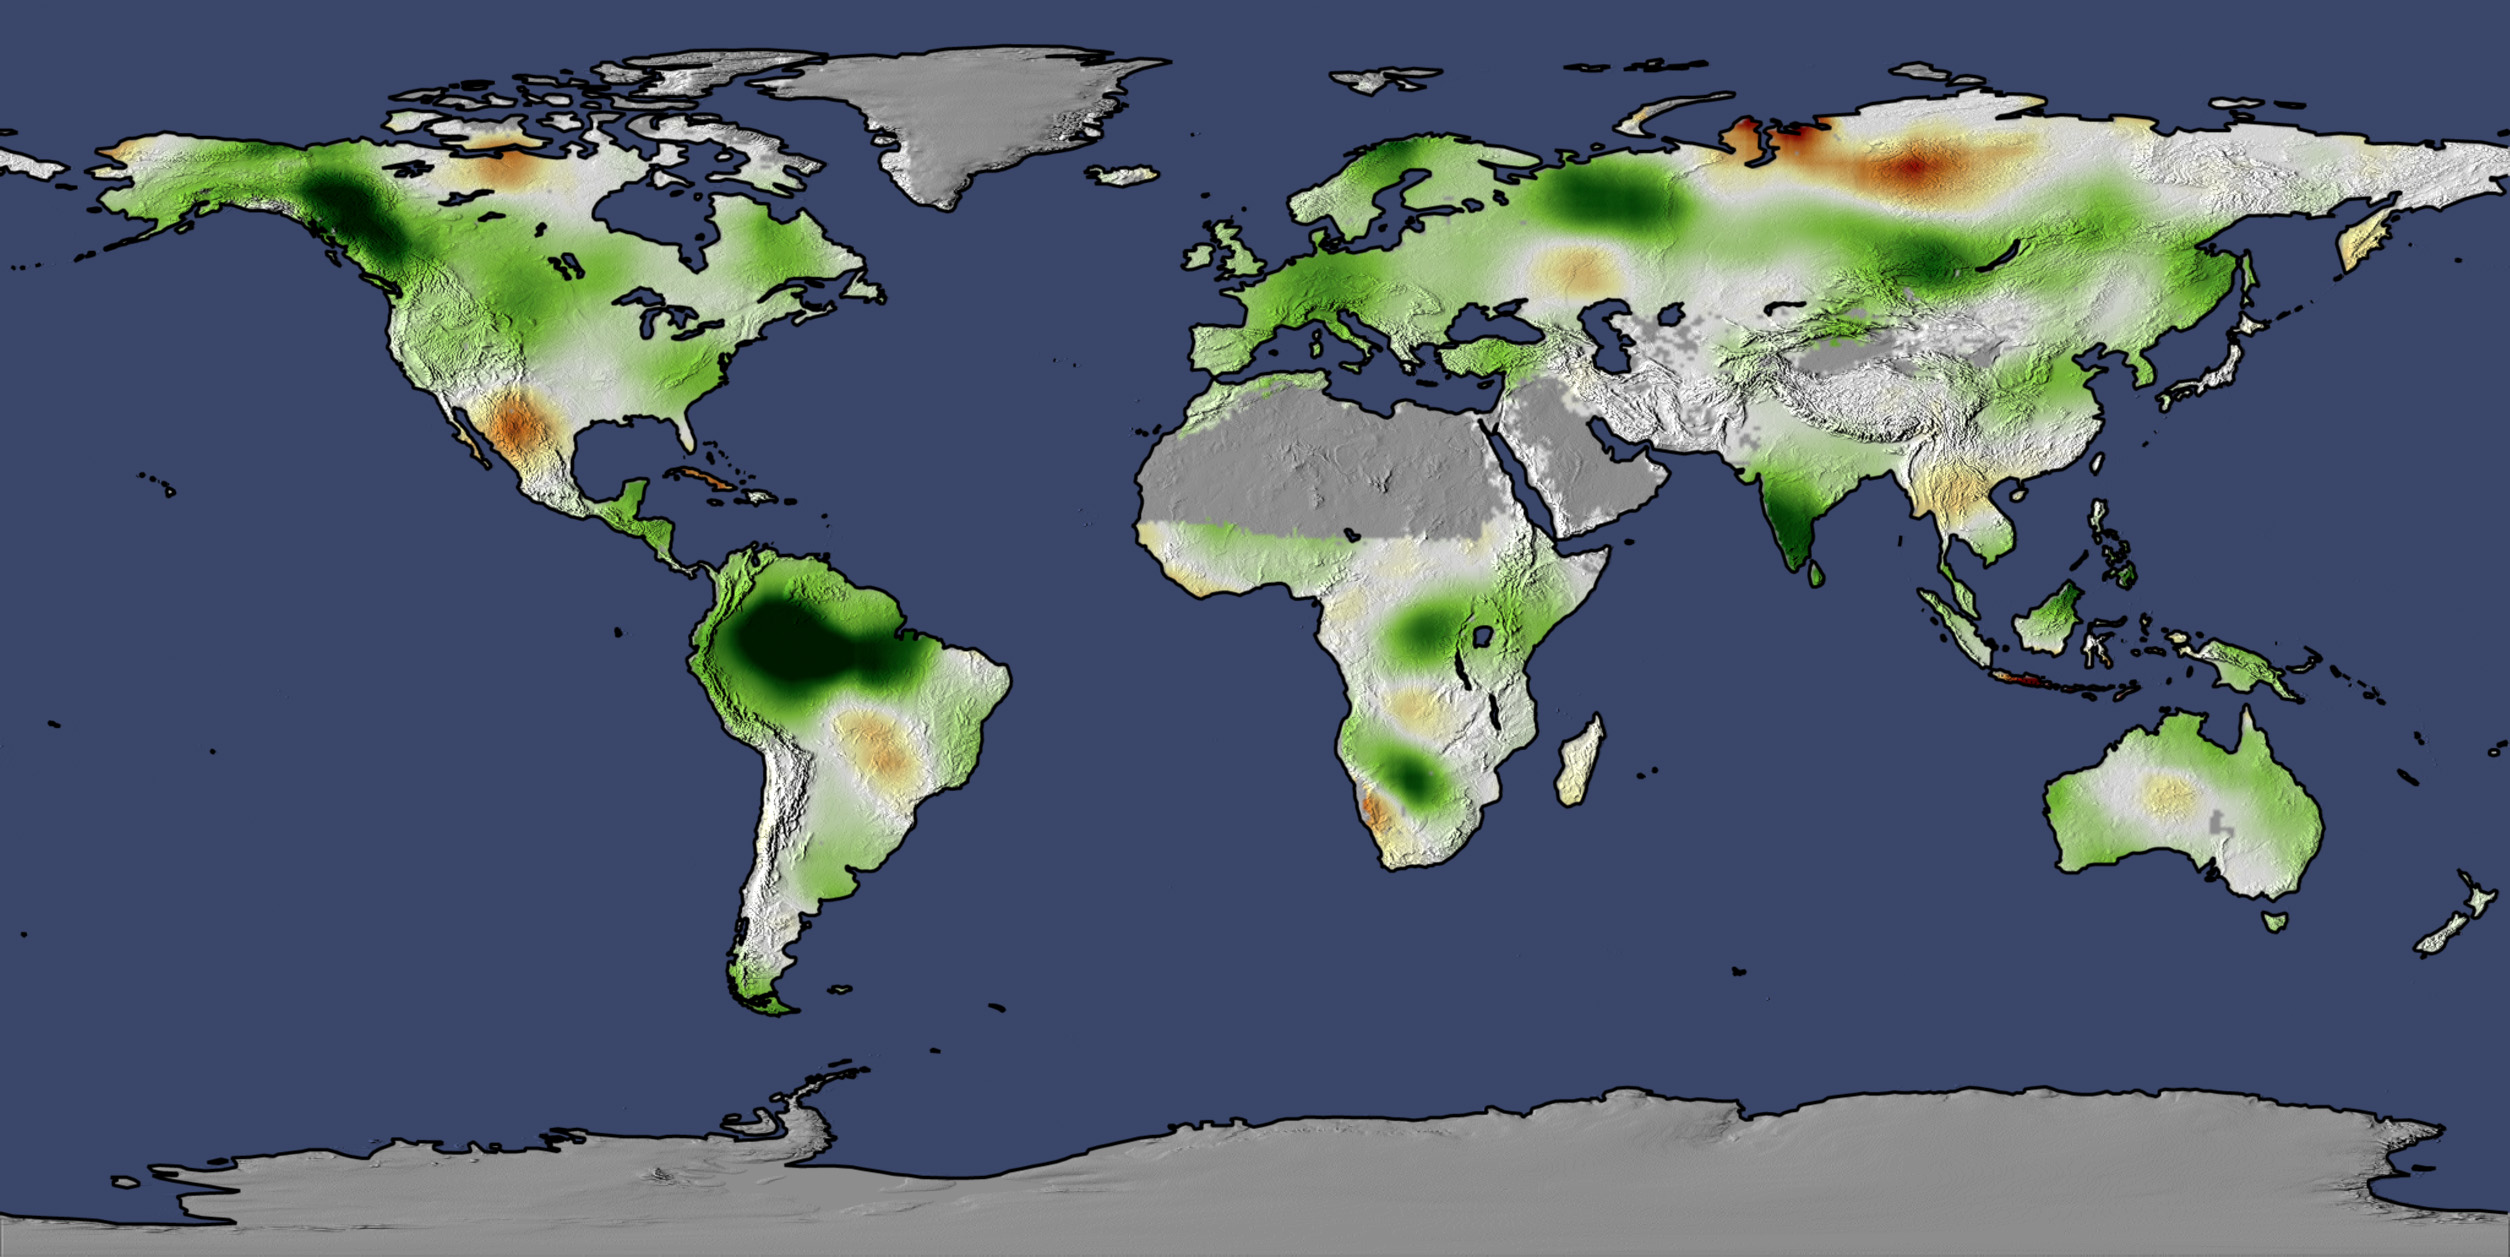
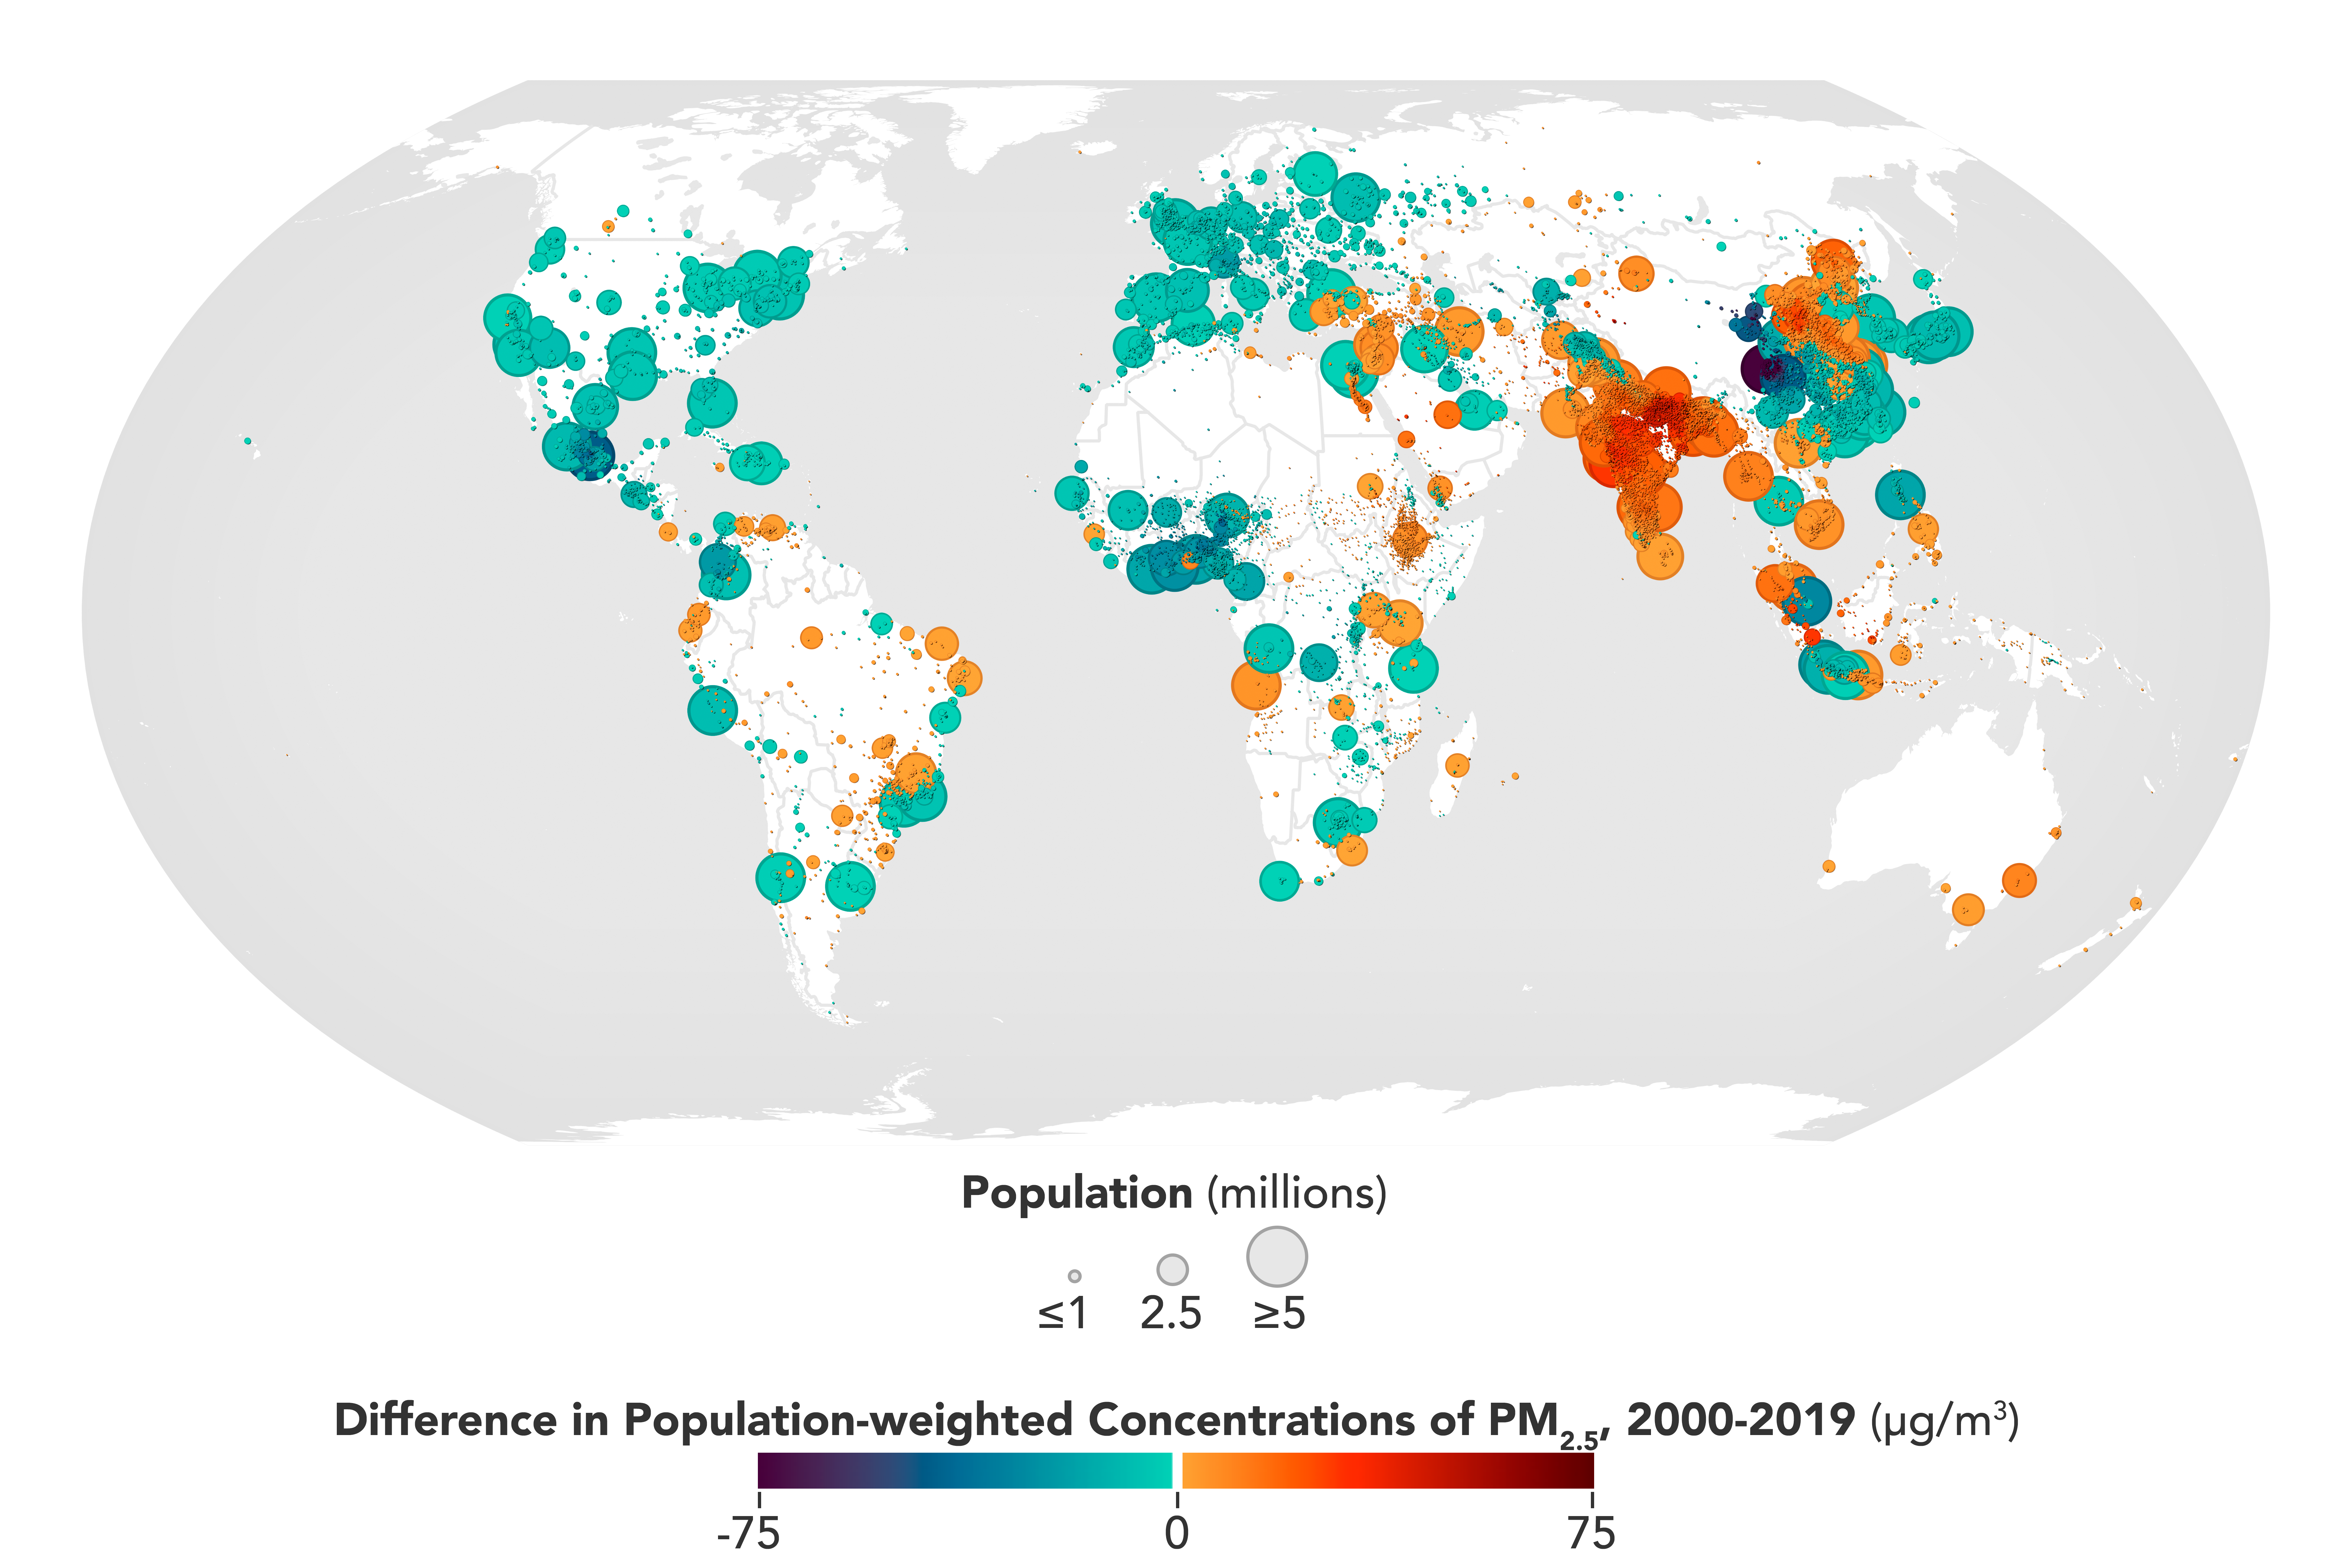
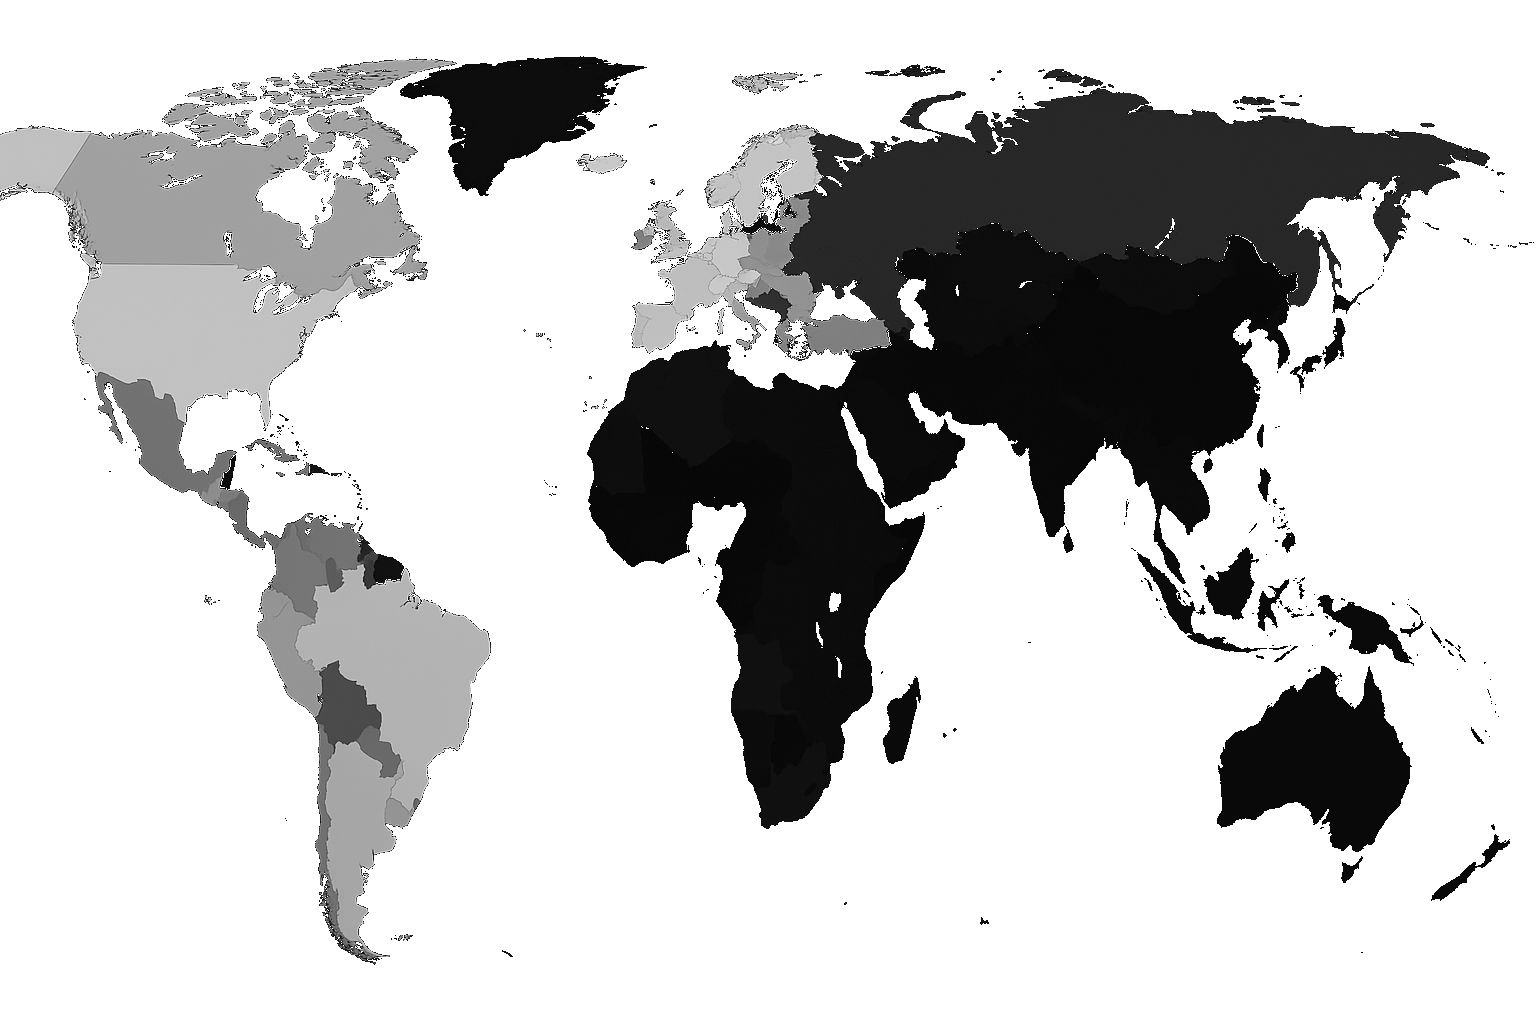
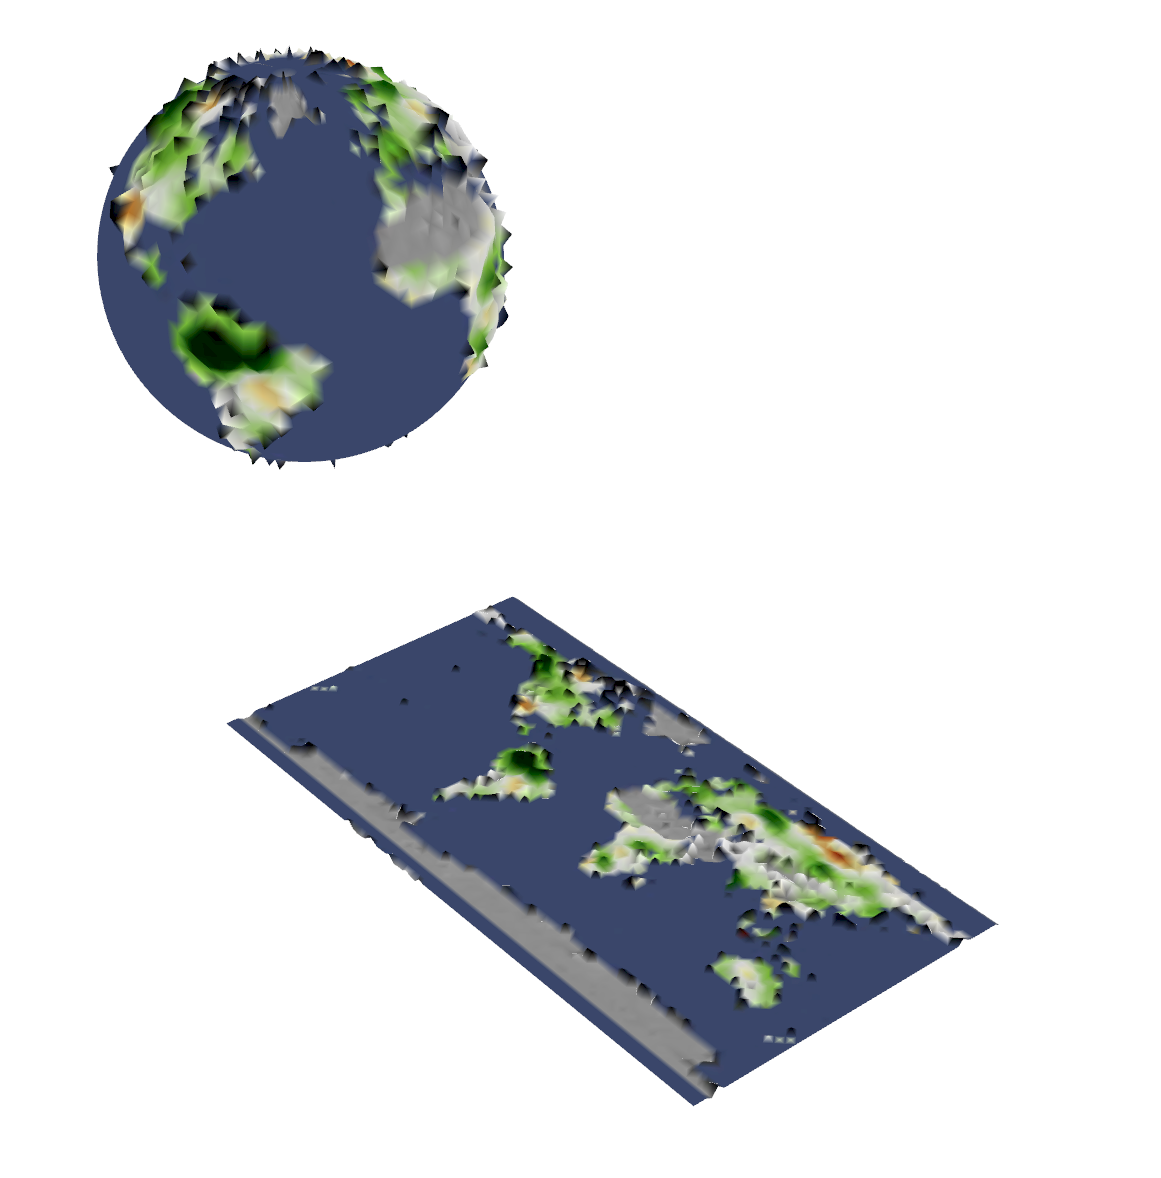
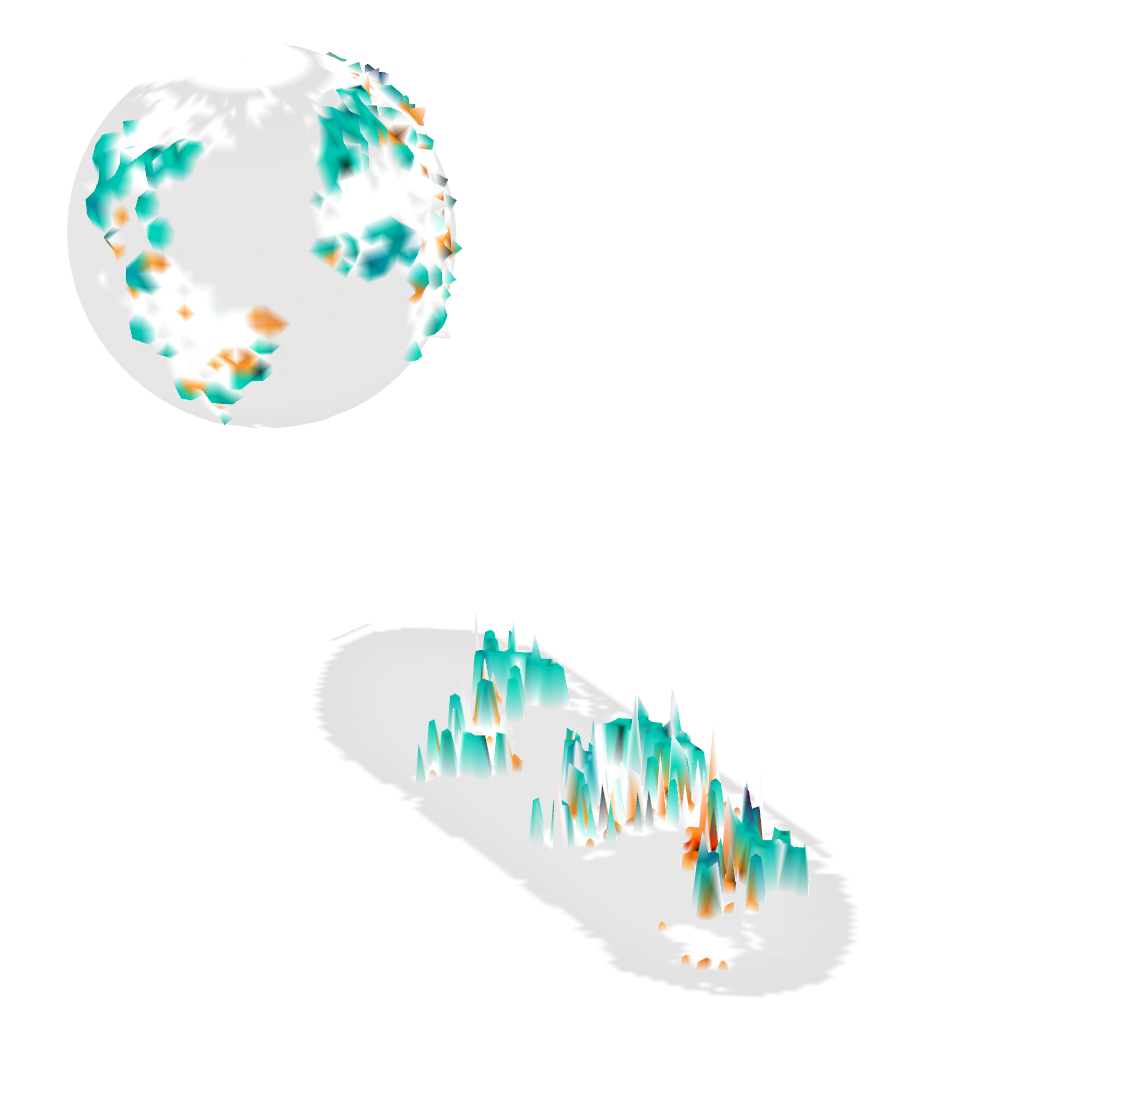
We used topograpgy data, vegetation cover and forests data, air quality data and a little more interesting we looked at social history; data related to colonial patterns
data workflows
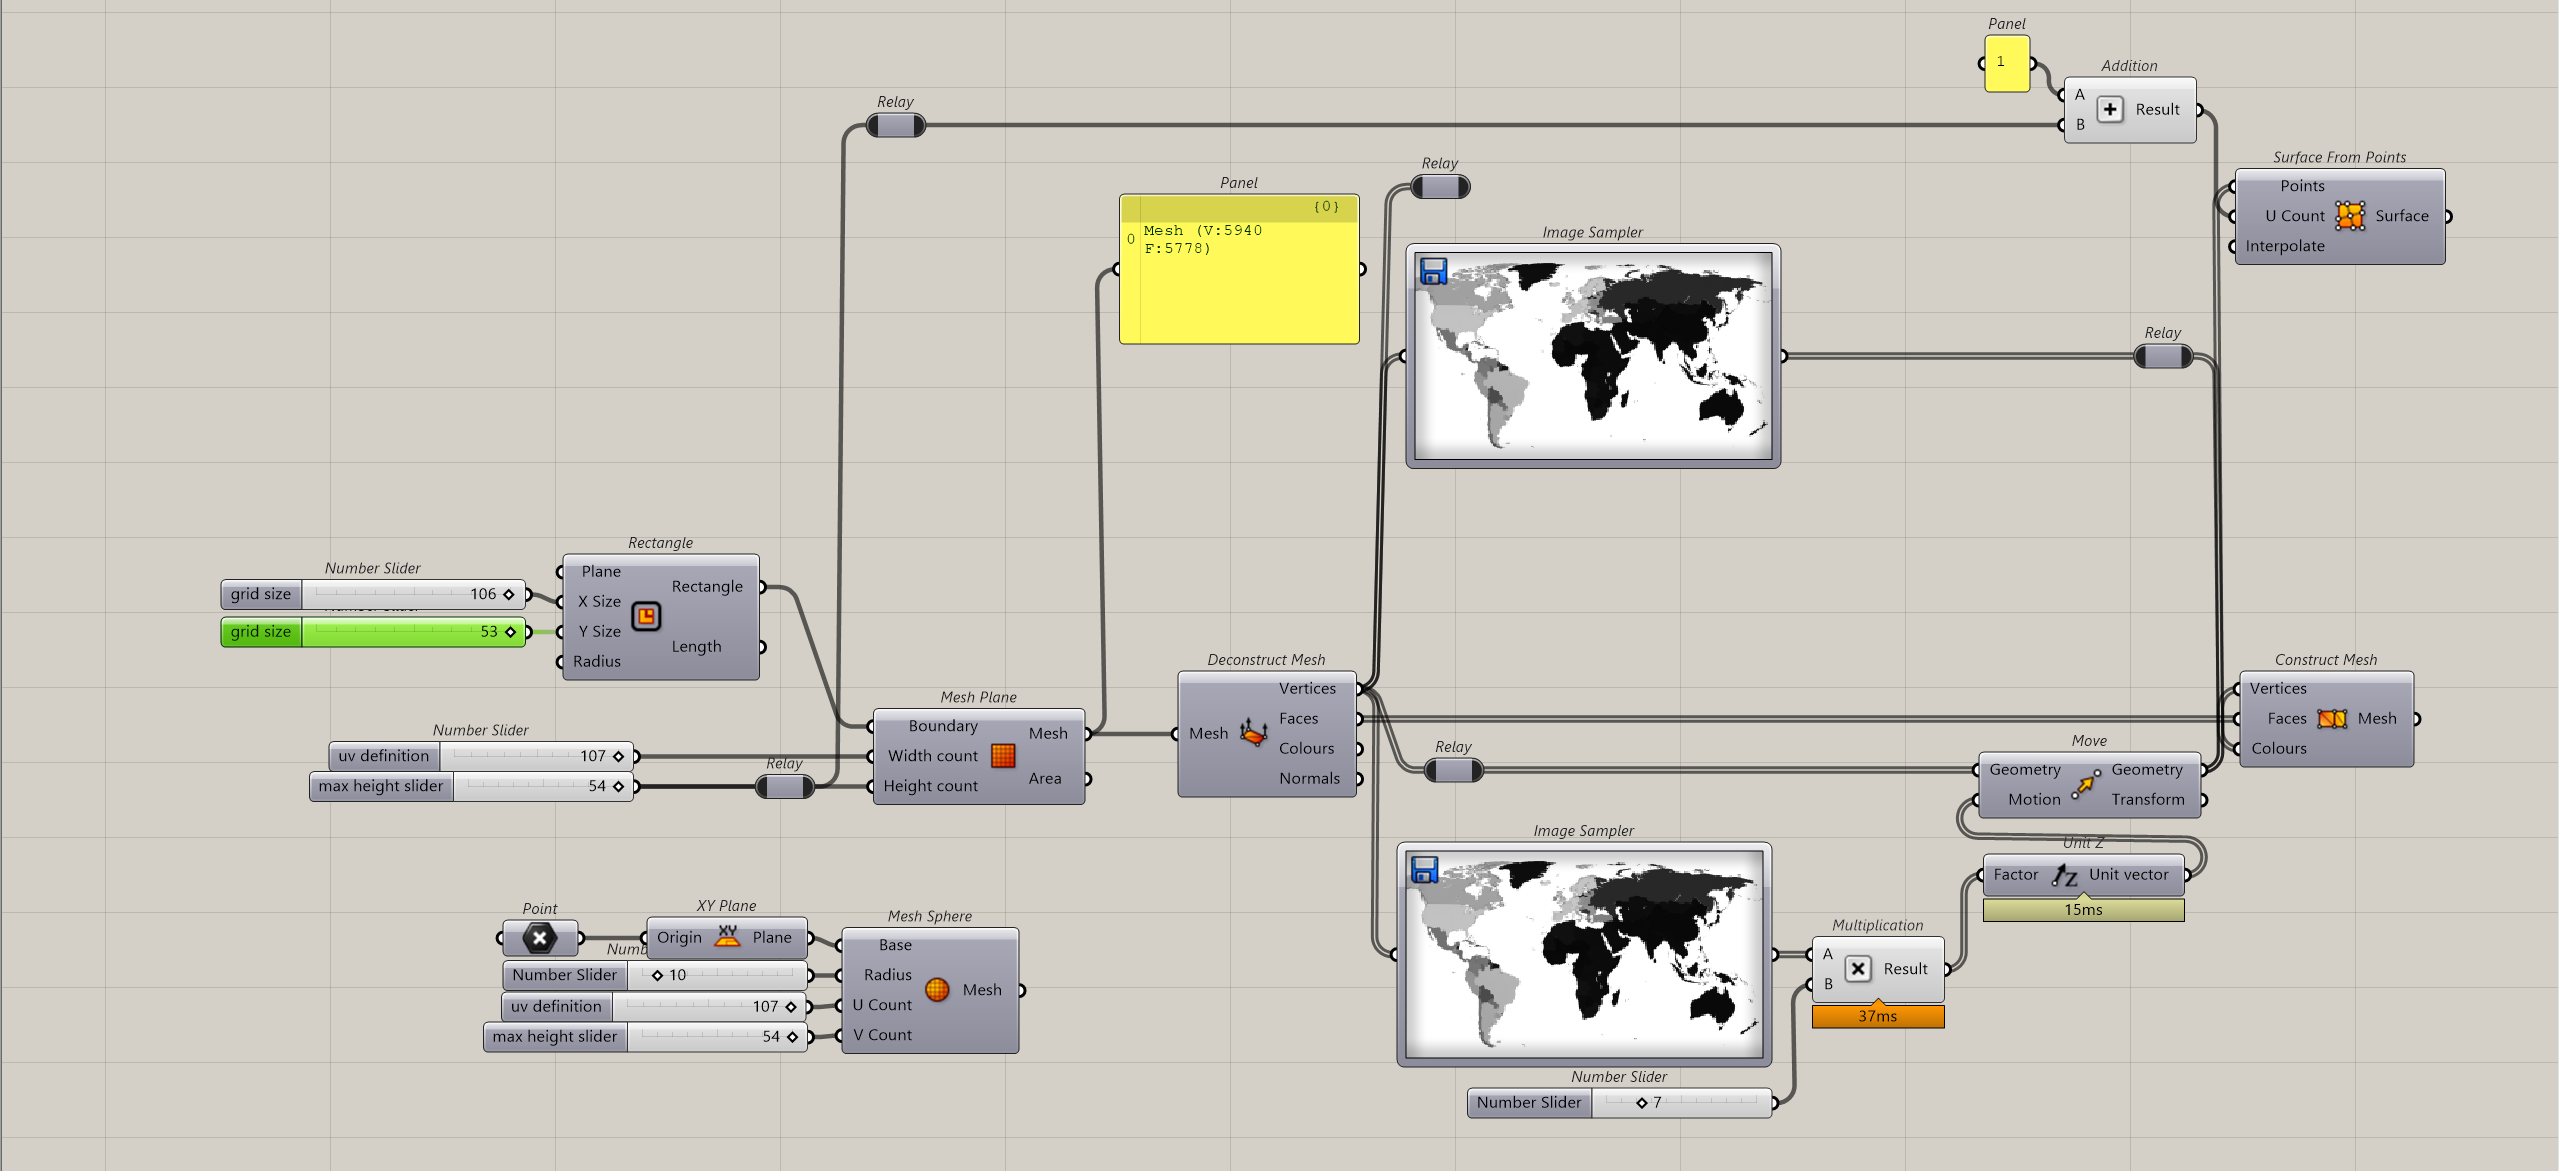
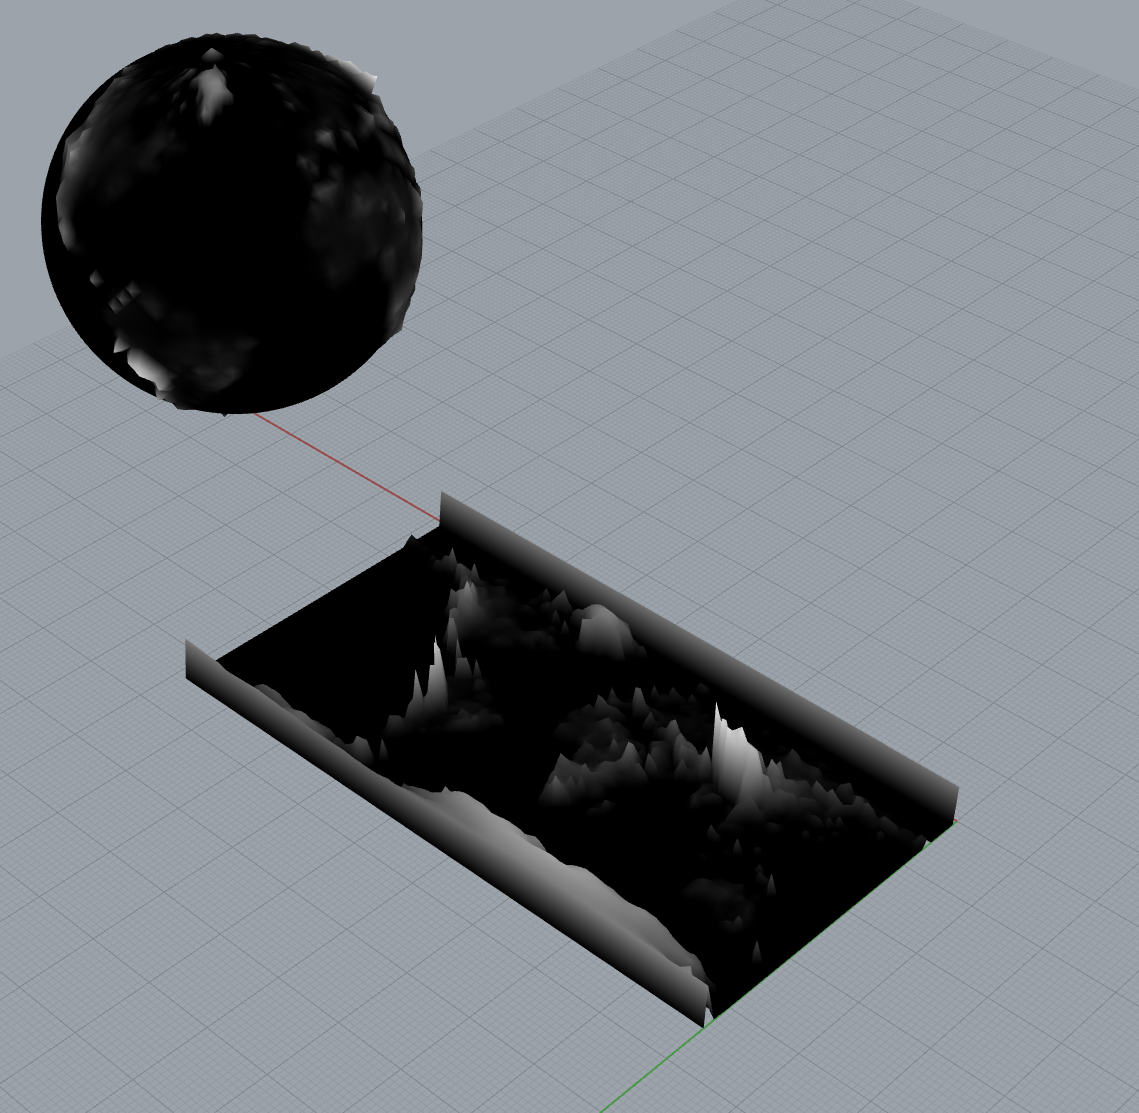
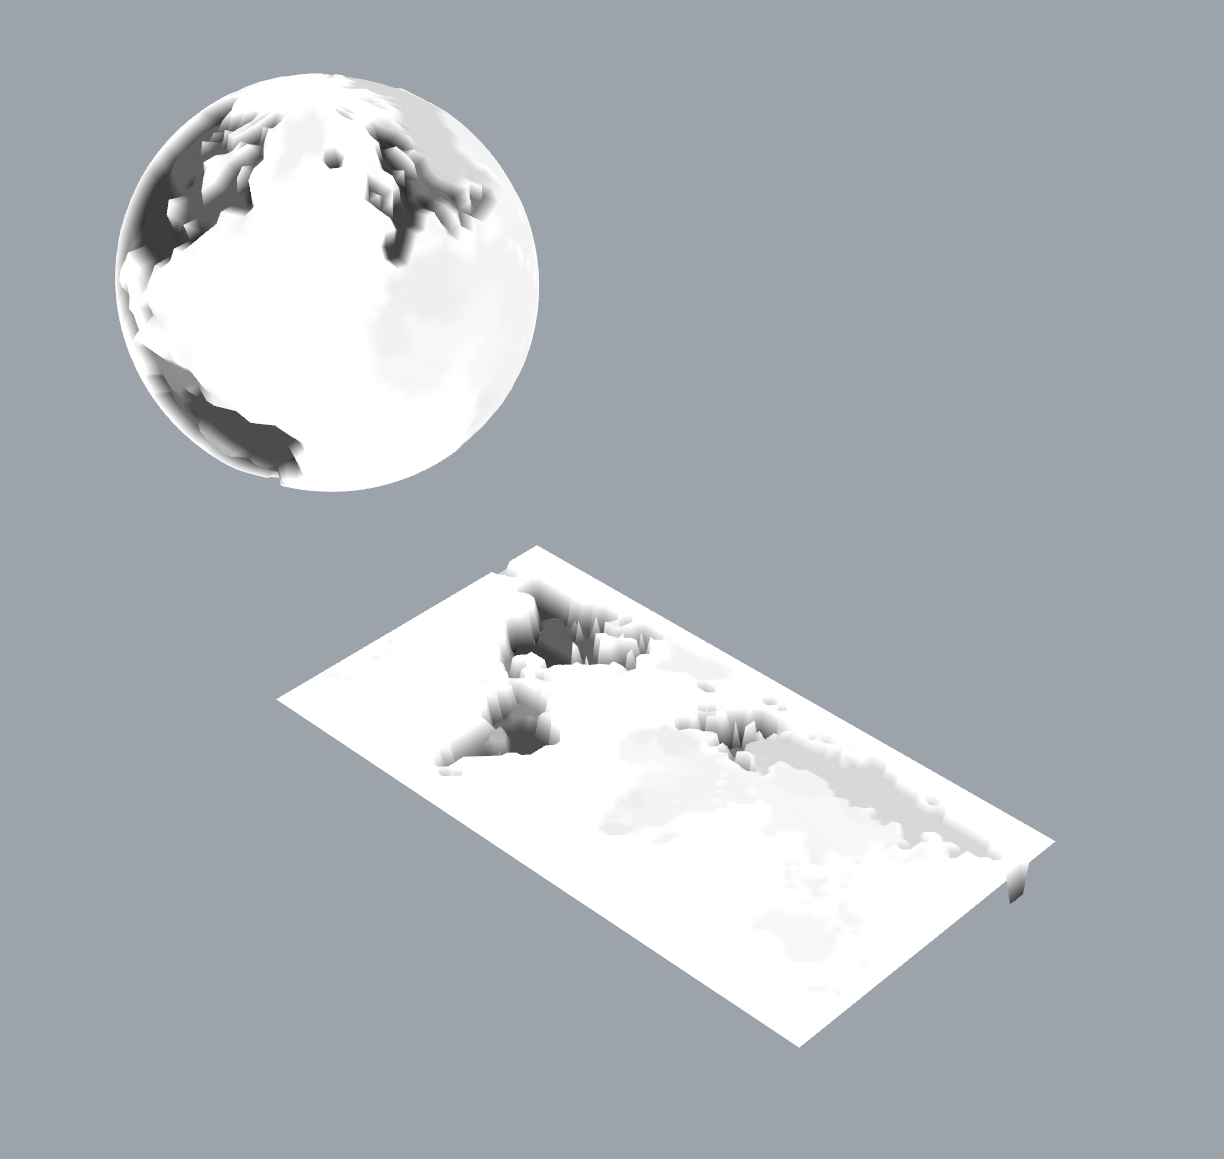
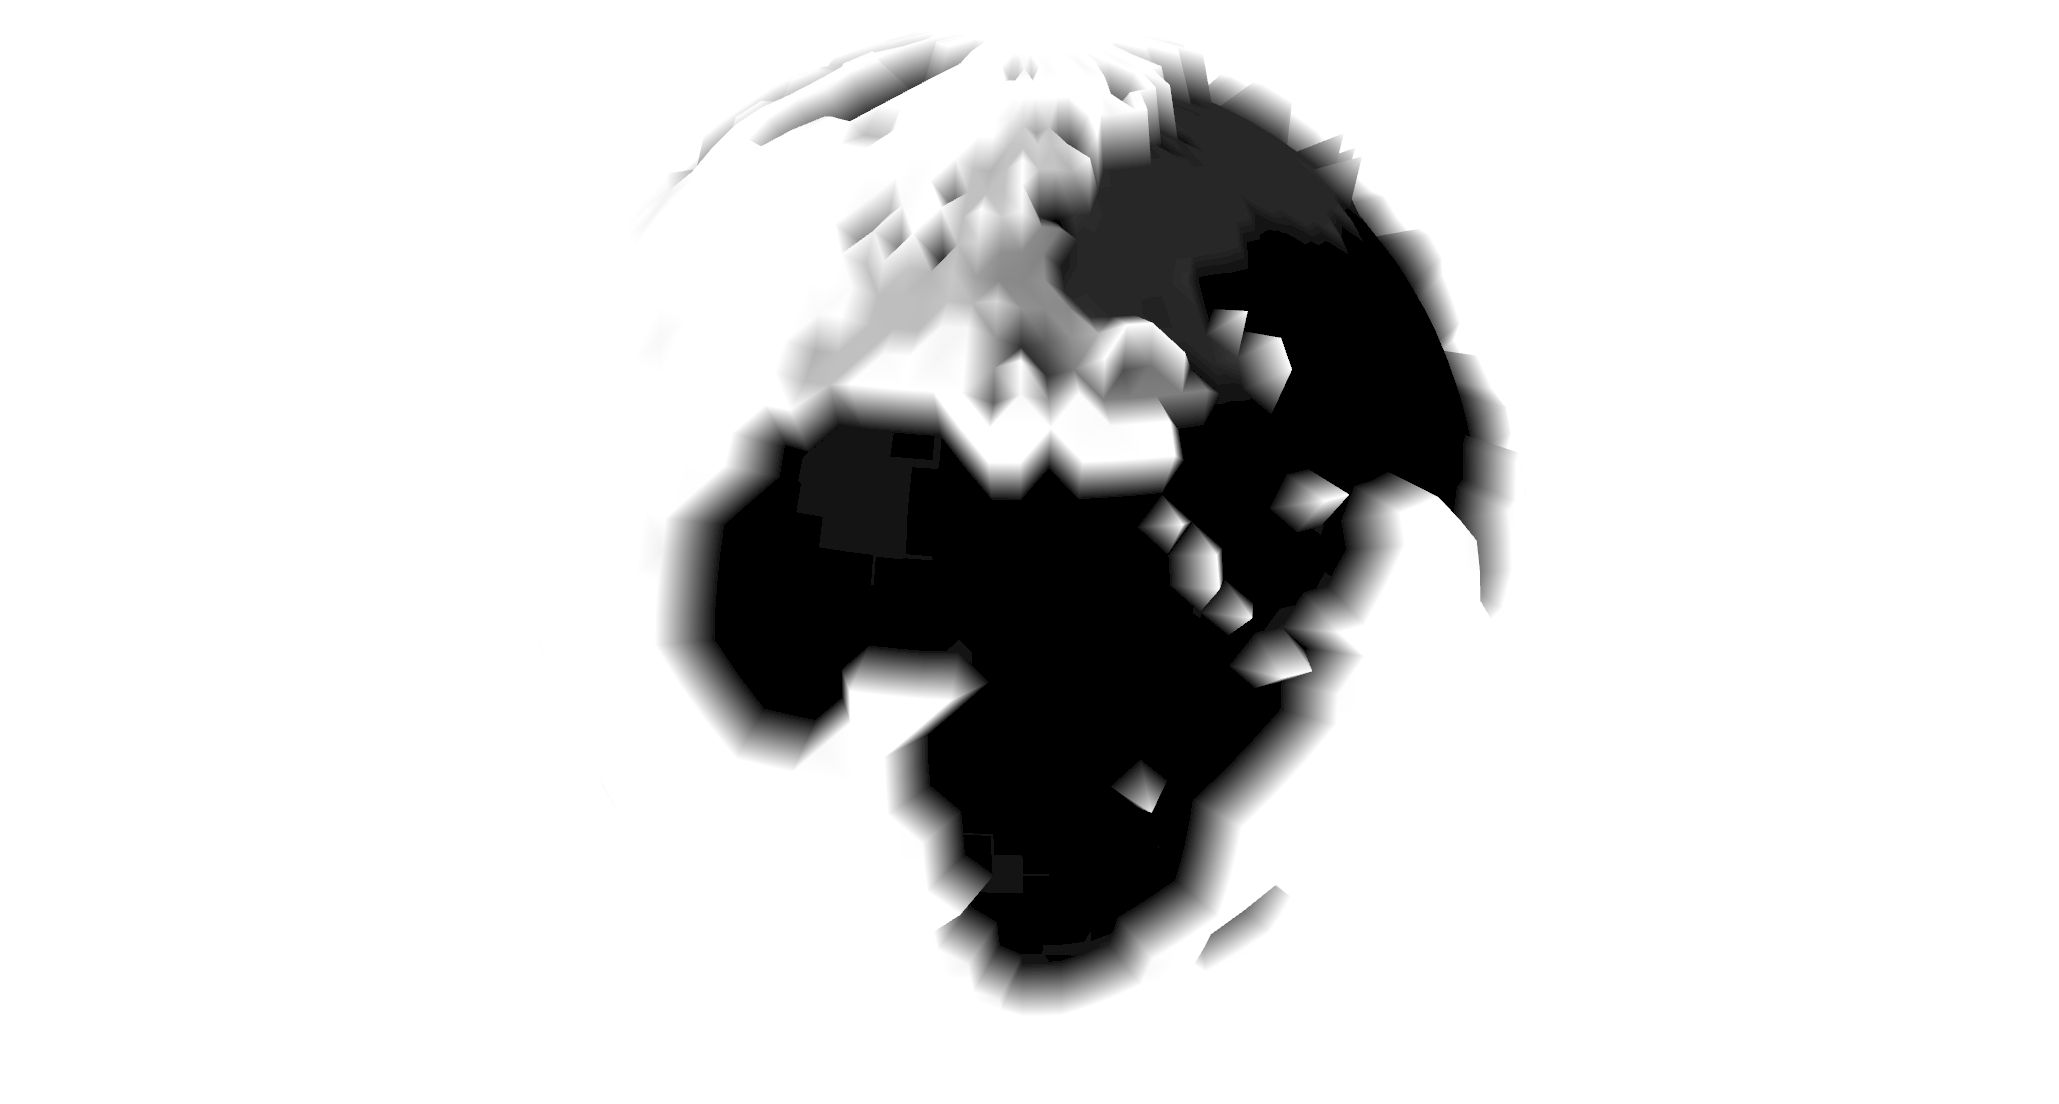
The first model was based on creating height maps from the images we werer surveying using the image sampler in grasshopper. The height maps were then used to create a mesh which was then used to create a flat earth 3D mesh model.
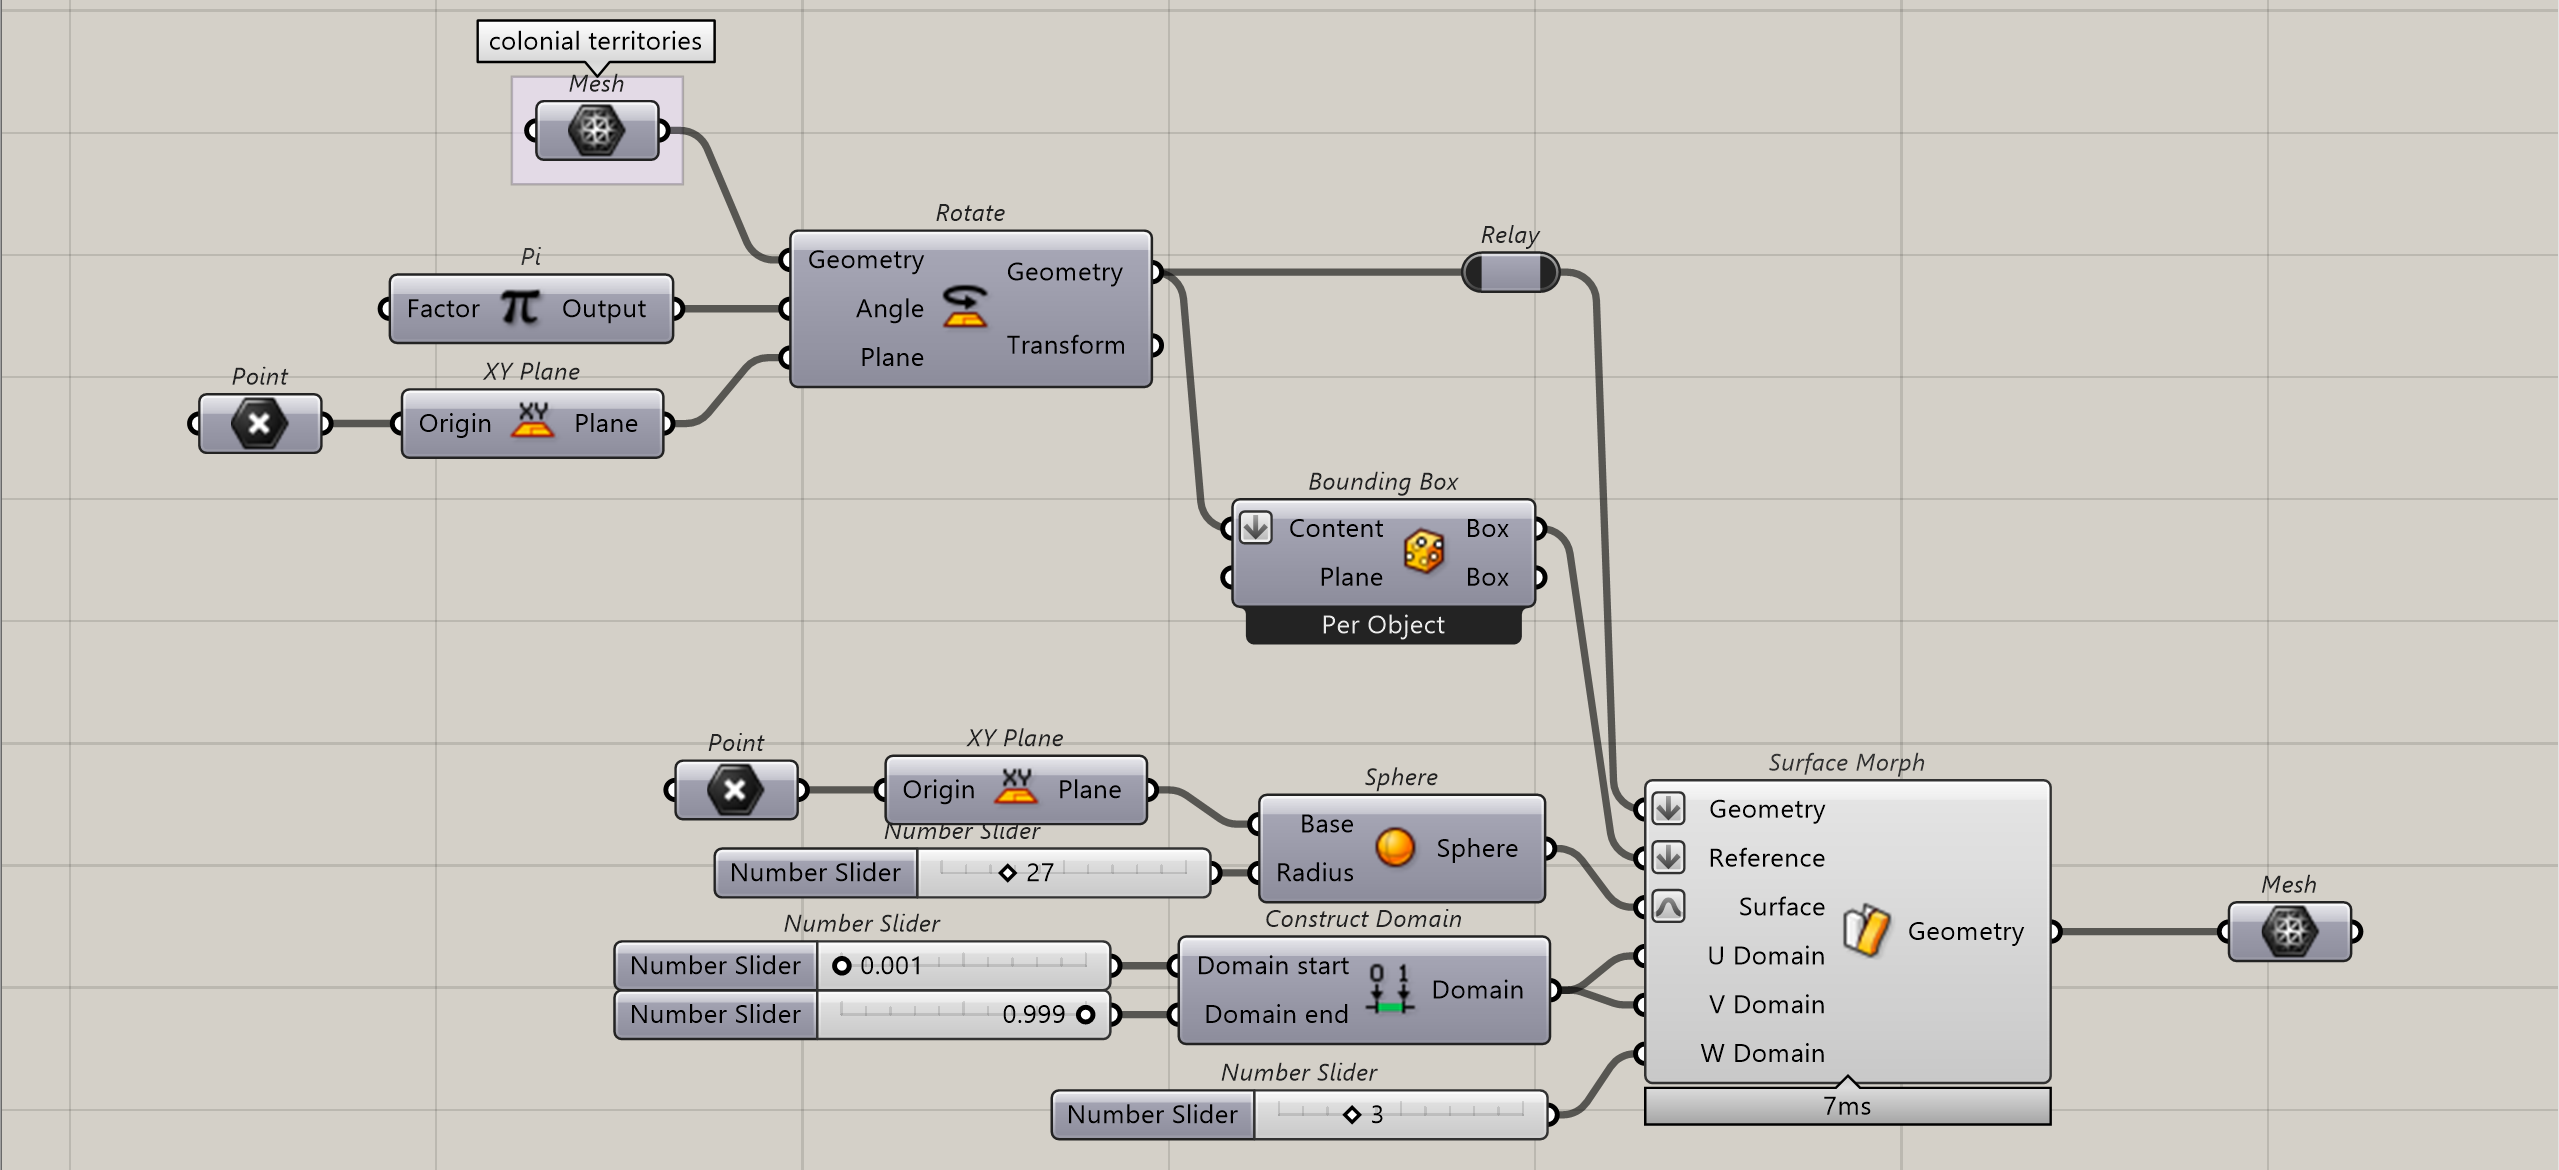
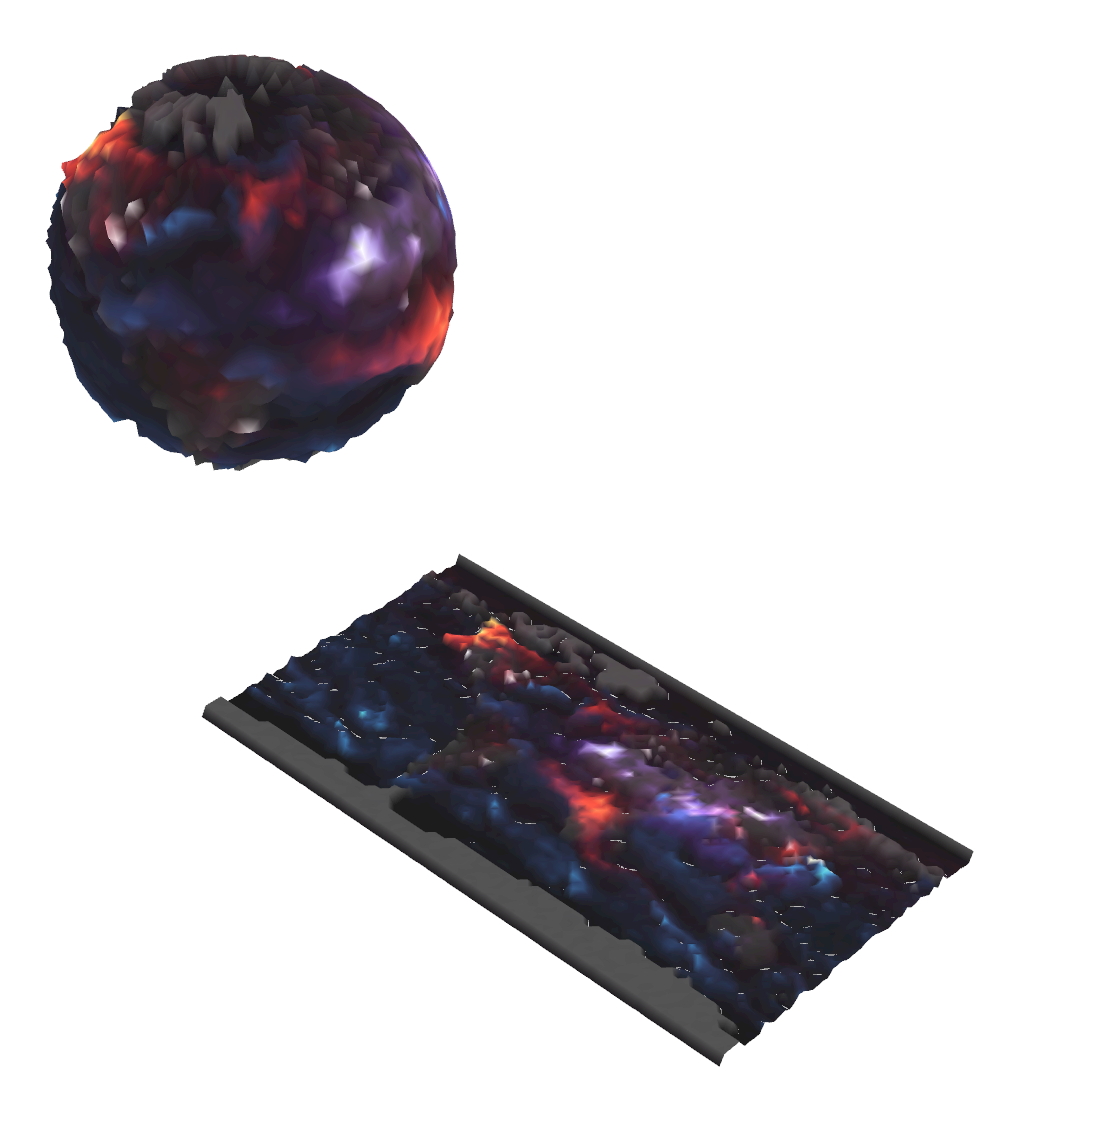
The second model was how based on wrapping the flat earth 3D mesh model onto a sphere. The sphere was then used to create a sign distance field voxel representation. The voxel representation was then used to genetrate the positive and negative meshes.
mini Globes